
Article
Information without a source is a claim
31 October 2026 · 5 min
Your AI assistant answers in seconds. But where does the figure come from?
An answer can sound convincing and still lack what you need to use it in a report: a clear source, the right period and a definition of what is actually being measured. Without those three, the figure is not statistics. It is a claim, however confident it sounds.
That is the starting point of our new film. A figure should be traceable back to its origin. This article is the film in text form: what Statistics Sweden (SCB), the Riksbank, the National Institute of Economic Research, Eurostat and the Swedish Companies Registration Office (Bolagsverket) add to a figure, and how you get it directly in Claude, ChatGPT or Cursor.
Two ways to answer the same question
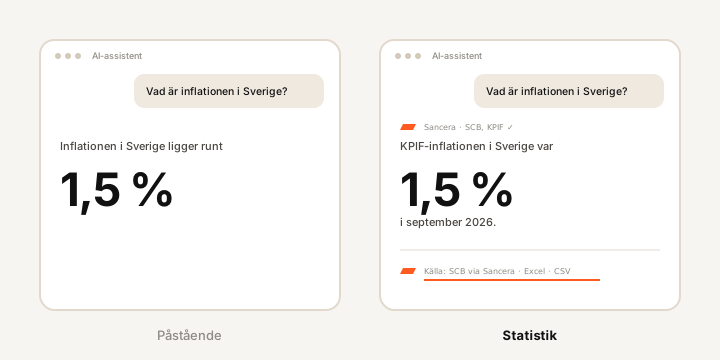
You ask: “What is inflation in Sweden right now?” An AI assistant can answer that in two different ways, and they look almost identical on screen.
The first way is to answer from memory. The language model has read articles, analyses and summaries up to a certain date and builds an answer that sounds right: “Inflation in Sweden is around 1.5 per cent.” But before you use the figure, you need to know more. Is it CPI or CPIF? Which month? Is it even current? Even a correct figure becomes misleading without its context.

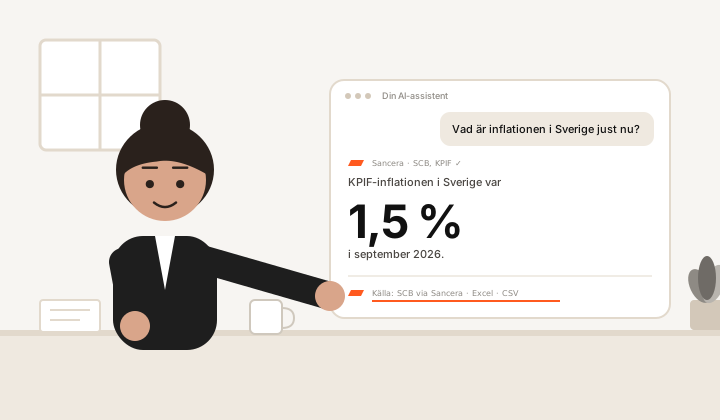
The second way is to fetch the figure from the source. The assistant looks up the value in SCB's table when the question is asked and answers with what is published now. The answer gets a line that makes it checkable:
Sancera · SCB, CPIF
1.5 %
CPIF inflation in Sweden, September 2026
Source: SCB via Sancera · Excel · CSV
Three things come with it: the measure (CPIF, the Riksbank's target variable), the period (September 2026) and the source (SCB, with a link to the table). The same figure as in the first answer, but now a dataset.
The difference becomes clearer as the question grows. The film's follow-up is “And the policy rate, the business cycle and the growth forecast?” Three figures from three institutions, which normally take three websites and three table formats:
| Figure | Measure | Source and period |
|---|---|---|
| 1.75 % | Policy rate | Riksbank, effective from 29 October 2026 |
| 108.1 | Economic Tendency Indicator | National Institute of Economic Research, October 2026 |
| 2.5 % | GDP growth Sweden 2026, forecast | IMF World Economic Outlook, October 2026 |
Source: Riksbank, National Institute of Economic Research and IMF, retrieved via Sancera 30–31 October 2026.
What an answer needs to show
A source reference does more than name the publisher. It helps you judge whether the figure answers your question. A usable answer therefore always shows three things:
- Measure: What does the figure describe? CPI or CPIF, outcome or forecast, legal entities or local units.
- Period: When does it apply? Month, quarter, year or the date a decision takes effect.
- Source: Who published the figure, and where can it be checked?
Different questions need different data, and it is the source that makes the scope visible.
Statistics Sweden (SCB) is Sweden's official statistics agency: inflation (CPI and CPIF), unemployment, GDP, population and wages. For inflation you need the right index and the right month, and SCB's table states both.
The Riksbank publishes the policy rate, exchange rates and market rates. For the policy rate you need to know the date it applies from, since it changes with every rate decision.
The National Institute of Economic Research (KI) produces the Economic Tendency Indicator and forecasts. 108.1 only means something once you know that 100 is the historical average and that the reading is for October 2026.
Eurostat and the ECB provide harmonised inflation (HICP), GDP by country, unemployment and euro area rates. To compare Sweden with Germany, both figures must rest on the same definition.
Bolagsverket and SCB's business register answer questions about companies, ownership, annual reports and the number of players by industry and size class. The number of legal entities is not the number of clinics, shops or local units, and the register source shows which one you got.
The IMF, OECD and World Bank provide forecasts and international comparisons. A growth forecast needs both the forecast year and the edition, because the next edition may say something else.
Official statistics in the assistant you already use
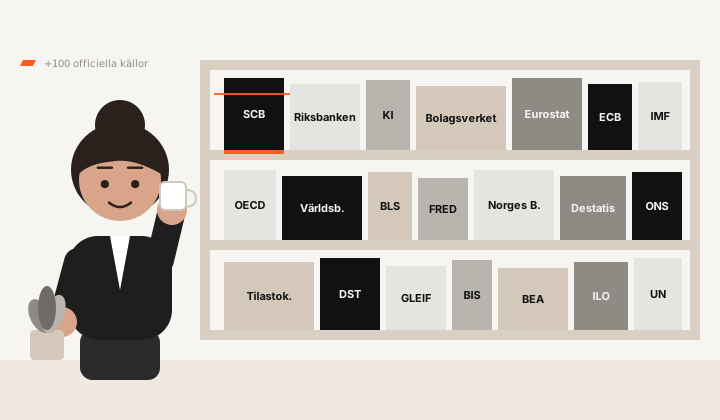
No new assistant is needed. Claude, ChatGPT and Cursor can be connected to external data sources through MCP (Model Context Protocol), an open standard that lets the assistant fetch data outside its own model. Sancera is such a connection, built for official statistics from 100+ sources: SCB, the Riksbank, the National Institute of Economic Research, Bolagsverket, Eurostat, the ECB, the IMF, the OECD, the World Bank and the corresponding agencies in the Nordics, Europe and the US.
You ask the question in plain language in your assistant. When it uses Sancera, measure, period and source reference come with the data, so you can review the dataset and go on to the original source. The data can also be exported to Excel or CSV to work with further.
That shortens the path from question to dataset. You can fetch, review and compare the figures in the same conversation where you calculate and write, instead of opening three websites and pasting numbers from a PDF.
Check before you conclude
An official source does not guarantee that every comparison or conclusion is right. You still need to judge whether the measure fits the question, whether the periods are comparable and whether the figure is an outcome or a forecast. But with the source in place you have something concrete to review. Without it you have a claim.
Next time your assistant gives you an exact figure, ask for more:
Show the measure, the period and the original source.
That is a good start on a dataset that both you and the next reader can check.
Discover Sancera
Free to start, no card required.
Read also: Your AI assistant sounds confident. But which month does the figure refer to? →Figures in the article: CPIF 1.5 % September 2026 (SCB), policy rate 1.75 % from 29 October 2026 (Riksbank), Economic Tendency Indicator 108.1 October 2026 (National Institute of Economic Research), GDP growth 2026 2.5 % (IMF WEO October 2026). Retrieved via Sancera 30–31 October 2026. Statistics may be revised after publication.